Por Center for climate and resilience research.
Using tens of thousands of trees of 12 species and millions of their growth rings, we reconstruct how the availability of water in the soil has changed over most of South America between the years 1400-2000. As a metric we use the “Self-calibrated Palmer Drought Severity Index (scPDSI)”, which is one of the most common and widely used metrics to characterize the water availability in the soil.
The scPDSI calculation is made based on monthly instrumental records of precipitation, temperature and potential evapotranspiration, with which the tree ring records are then calibrated, reconstructing and extending the scPDSI record through the studied territory into the past. A characteristic of the scPDSI is that it is calculated for each area unit (grid) and changes based on the climatic regime of each place. The scPDSI has a scale of values that indicates the severity of droughts (negative values) and excess humidity (positive values) for each specific time and place.
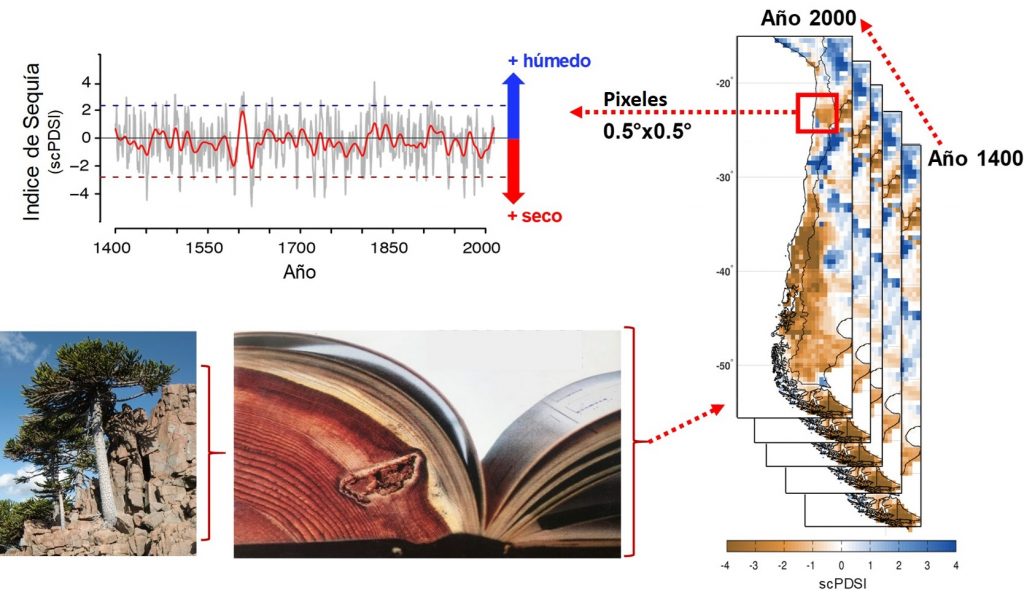
The territory that we cover with the South American Drought Atlas ranges from 12 ° S to the South including Chile, Argentina, Bolivia, Paraguay, Uruguay and Southern Peru and Brazil. The reconstruction field is composed of 2715 grids of 0.5 ° x 0.5 ° latitude / longitude equivalent to 55 km x 55 km. This Atlas would be a 600-page “book” in which each page corresponds to the South American drought map for each particular year, in which each grid presents the average scPDSI value of the summer months (December – February) which, given the monthly autocorrelation nature of the scPDSI, results in each value practically representing the level of annual water availability. The year assigned for each “page” of this Atlas is the respective month of December.